Claude Code Insights: The Command That Audits Your Habits
Claude code insights is a slash command that reads your recent Claude Code sessions and writes a report on how you have been working with it. It looks past your configuration and at the work itself: what you build, where your time goes, and which patterns keep repeating. You type /insights in the terminal and it hands the report back to you.
I ran it across 173 of my own sessions. This post covers what the report contains, which three sections are worth your time, and the two things about it that are easy to misread.
Key Takeaways
/insights generates a report analyzing your Claude Code sessions, including project areas, interaction patterns, and friction points.- It reads a recent window of your history, not all of it. Mine covered 173 sessions out of the 646 that exist.
- The report I got had 8 sections. Three of them are worth your time, and the rest you can scroll past.
- Each of those three sections ends with a prompt you paste straight back into Claude Code, so the finding turns into a change.
- Some of what it reports is counted and some of it is estimated by a model. Knowing which is which changes how much weight to give it.
What Is the Claude Code Insights Command?
The Claude Code insights command is a built in slash command that produces a report about your own session history. Anthropic's own documentation describes it in one line: "Generate a report analyzing your Claude Code sessions, including project areas, interaction patterns, and friction points." It is one of more than a hundred slash commands, and one of the few worth running on a session you have already finished.
That last phrase is the interesting one. Friction points means the report is looking for where the work went sideways, and it names them.
To be clear about what this is not: it is not new, and I am not going to pretend I discovered it. It has been sitting in Claude Code for a while. I had simply never bothered to run it until now.
My report came back with 8 sections.

One note before you go looking for them. The navigation chips at the top of the report and the headings inside the body do not always use the same words. The chip reads "New Usage Patterns" while the section itself is headed "New Ways to Use Claude Code". Same section, two labels.
How to Run Claude Code Insights
Running it takes one line and no setup.
- Open Claude Code in your terminal, in any project.
- Type the command and press enter:
/insights
- Wait for it to read your history. It works through your recent sessions and then hands the report back. On my run it wrote the report out and gave me a link to open it.
- Skip to the three sections that matter. Features to Try, New Ways to Use Claude Code, and Where Things Go Wrong. The report is long and the other five sections are context rather than action. Features to Try is where something like custom spinner verbs tends to surface, a setting that was there the whole time and never got flagged until something finally read your history.
- Copy the prompt at the end of a section back into Claude Code. That is how the finding turns into a change.
There is nothing to install and nothing to configure. If you have been using Claude Code, the data is already there.
What the Report Actually Contains
Here is what the 8 sections cover, and which ones earn your attention.
| Section |
What it holds |
Worth reading |
| What You Work On |
Your projects and the areas you spend time in |
Skim |
| How You Use CC |
Message counts, files touched, lines changed |
Skim |
| Impressive Things |
Work it rates as notable |
Skip |
| Where Things Go Wrong |
Friction points, error types, lost time |
Read |
| Features to Try |
Built in features you have not used |
Read |
| New Usage Patterns |
New ways to work, with prompts attached |
Read |
| On the Horizon |
What is coming |
Skim |
| Team Feedback |
Collaboration signals |
Likely thin if you work alone |
What It Looks Like on a Heavy Month
The report opens on a row of counts, which is the fastest way to see how much history it actually read.
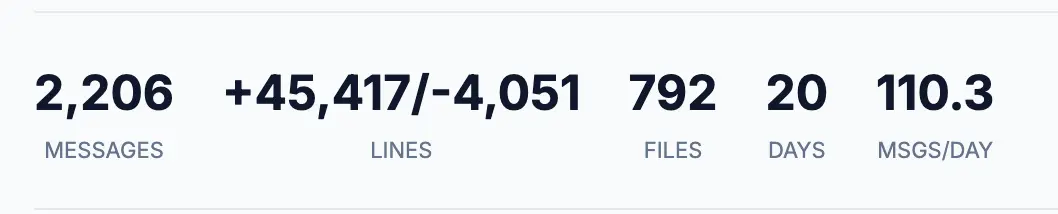
Mine came back with 2,206 messages, 45,417 lines added and 4,051 removed, across 792 files, at 110.3 messages a day. The report's own summary of that stretch was that I got a high rate of successful outcomes across the 173 sessions it read.
One number on that row is easy to misread, and I misread it myself at first. The "20 DAYS" is the count of days I actually opened Claude Code, not the length of the window. The window in my report header was 37 days. That is why the daily average divides by 20 rather than by 37, and it is worth checking before you compare your number to anybody else's.
How to Read the Friction Section
Where Things Go Wrong is the section I would run the command for, and it is also the one most likely to be read wrong.
It gives you two different kinds of thing, and they do not carry the same weight.
| What it shows |
Where it comes from |
How much to trust it |
| Error and event counts |
Counted from your session logs |
High, these are tallies |
| Friction categories |
Sorted from what it counted |
High on the shape, not the labels |
| Satisfaction estimate |
A model reading your transcripts |
Low, nothing surveyed you |
The counts are counts. The satisfaction figure is labelled model estimated in the report itself, which is the tell: nobody asked you how a session felt, so something inferred it from the words you typed. Read it as a mood guess, not a measurement.
The bigger reading error is treating the error counts as a scorecard. Failed tool calls are ordinary in agent work. A command that misses and gets retried is not a broken session, it is a normal one. What the breakdown is genuinely good for is showing you where retries cluster, because a cluster is a pattern and a pattern is something you can fix once.
Then read the paragraph rather than the charts. The charts tell you how much. The paragraph underneath tells you what kind, and it is usually pointing at something upstream of the code: the scope that was agreed too loosely, the check that did not happen, the round of corrections that repeats. Those are the findings worth acting on, because none of them are a setting you can toggle.
Insights or Doctor: Which One You Want
Claude Code has two commands that both feel like a checkup, and they look at completely different things. Running the wrong one gets you a clean bill of health for a problem you do not have.
|
/doctor |
/insights |
| What it reads |
Your installation, files, plugins |
Your recent session history |
| What it finds |
Setup that is broken or stale |
Where your time goes |
| Run it when |
Something is misbehaving |
Nothing is broken and it still feels slow |
/doctor checks your setup. /insights checks the work. If you have never touched either, /doctor is the faster one and takes seconds. /insights is the one you come back to.
If /doctor turns up connections you no longer use, the test for which ones earn their place is in the post on the best MCP servers.
The Prompts Are the Reason to Finish the Report
The useful part of this report is that it does not stop at the diagnosis. The "New Ways to Use Claude Code" section says so outright, above a set of cards: "Just copy this into Claude Code and it'll walk you through it." Each card is a suggestion with a prompt already written for it, generated against what the report saw in your own history rather than a generic tip list.
So the loop closes inside the tool. It finds the pattern, writes the prompt, and you paste the prompt back into the same terminal. If you want a deeper version of that habit, it is the same idea behind writing rules down as they come up rather than re learning them each session.
What It Does Not Do
Two limits worth knowing before you read too much into your own report.
It reads a window, not your whole history. Mine analyzed 173 sessions out of 646, so it saw about a quarter of what I have. Treat the output as a read on how you have been working lately rather than a permanent record. Your window may not match mine, and the range is not documented.
I could not confirm where the session data goes. I went looking through Anthropic's own documentation for something covering this command specifically and did not find it. I am not going to guess in either direction. If that matters for your work, take the question to Anthropic rather than take my word for it.
Frequently Asked Questions
What does the Claude Code insights command do?
The Claude Code insights command generates a report analyzing your recent Claude Code sessions. It covers the projects you work in, how you interact with Claude Code, and the friction points where work stalls or gets redone. Each of the main sections ends with a prompt you can paste back into Claude Code to act on what it found.
How do I run insights in Claude Code?
Type /insights in a Claude Code session and press enter. There is no setup and no flags. It reads your recent history and produces the report. On my own run it wrote the report out and handed back a link to open it, and it took a couple of minutes to come back.
Does Claude Code insights read all of my sessions?
No. It reads a recent window. My own run analyzed 173 sessions out of the 646 on my machine, over a span of 37 days. Anthropic's description says "your Claude Code sessions" and does not document a lookback range, so the honest answer is that it covers recent work and the exact window is not published.
What is the difference between insights and doctor in Claude Code?
/doctor checks your setup: your installation, your configuration files, and your plugins, the same territory as the settings worth checking first. /insights checks your work: your session history, your patterns, and where you lose time. Run /doctor when something is behaving oddly. Run /insights when nothing is broken and the work still feels slower than it should.
Is the satisfaction score in the insights report real data?
No. The report labels it model estimated. Nothing surveyed you at the end of a session. A model read the transcripts and inferred how satisfied you sounded, so treat those numbers as a rough signal rather than a measurement. The error counts and session counts alongside them are counted, not inferred.
What I Would Do With It
Run it once. Skip to Where Things Go Wrong, read the paragraph rather than the charts, and see whether it describes a pattern you recognize.
If it does, take the prompt at the end of the section and paste it back in. That is a ten minute exercise and it is the only part that changes anything.
The charts will get your attention first. The paragraph underneath them is the part worth your time.
If you would rather work through this kind of thing with someone, that is a lot of what I do in the AI workshop: the habits around the tools, not just the tools.